Apples, Oranges, and Iceberg Metrics
3 Rules of Thumb for Thinking About Data

How do you feel about metrics? Statistics? Analytics?
What happens when you look at a dashboard full of data or a spreadsheet stuffed with values that presumably tell you something about the world (and often your place in it)?
Whether it’s abject horror, curious titillation, begrudging resignation, or visceral delight, I assure you that you are not alone. Data—especially numbers that relate to action we could (or should) take—provoke a wide variety of responses, often all at the same time.
Metrics can offer a sense of control in a chaotic world. They seem to make sense of the squishy uncertainty of our day-to-day lives. And sometimes they do! Other times, metrics lead us to “insights” that change our behavior in ways that undermine our goals.
Understanding how to process and draw conclusions from data is massively important in a world dominated by data. And it’s a skill that many very smart people lack. I am no expert on the ways that data are manipulated to present desirable (or undesirable) narratives and shape action. But I’ve learned to be more skeptical about the face value of a metric—and the story I might think it’s telling on first blush.
That skepticism comes in handy when I’m talking with a client who brings me an audience analysis or revenue breakdown. I can help them question their own assumptions about that data and ask new questions that impact the action they take. It also comes in handy when reading the news, which frequently reports data in a way that makes for the best headlines rather than the most accurate impression of trends (e.g., “this chemical increases risk of cancer by 30%” instead of “researchers noted that this chemical is correlated to a 1.3% risk of cancer versus a 1% risk in the control group”).
Recently, I came across some data analysis that set me off. I felt anger toward the person who had purportedly stumbled on an important insight based on this data analysis. I was indignant at the credulous way he was treated in a podcast interview. And I was incensed that this kind of bullshit "analysis" can end up influencing the decisions that people like you make—whether you realize it or not.
So today, I want to do two things. The first is to tell you about this mess of data analysis in specific terms, demonstrate its wrongheadedness, and offer some basic rules of thumb for approaching data like these. And the second is to—hopefully—prod you into thinking about the data you encounter on a daily basis and whether the narrative you think it’s weaving is accurate.
But first, I need to set the scene. I'm going to get way into the weeds of the creator economy here—but if you stick with me, I think you'll see that this exercise is useful no matter what kind of work you do.
The Rise & Fall of the Clip Economy
Unless you live under a rock blissfully free of social media, you’re probably familiar with the phenomenon of posting clips of longer-form content on platforms where short-form video is the norm. You might come across a clip of your favorite celebrity podcast, or a clip from a comedy special, or a clip from a news broadcast. Instagram, TikTok, and YouTube Shorts are full of clips of one kind or another.
Clips are distinct from content created specifically for a 60- or 90-second runtime. They have their own conventions and appeal to viewers in different ways.
What you might not know about clips is that in recent years, “clip farms” have emerged as a cheap way of getting long-form content—especially long livestreams—ready for vertical video distribution. Often, “clippers” will not only create the videos but also post them to accounts created for the purpose of seeding viral videos and creating hype.
Clips help creators and performers diversify the platforms they can appear on without a huge investment of extra time creating even more content. They can help address distribution and discovery challenges that long-form content creators often face. And when done (what I consider) properly, they’re good content! A solid way to communicate small yet satisfying ideas.
Last week, Ryan Broderick from Garbage Day wrote about what he termed the “short-form video bubble” and asked what might happen when it inevitably pops. Looking out at his long career (in new media terms), he sees some familiar patterns, namely finding ways to spread ideas in tiny packages (e.g., GIFs, Vines, tweets, etc.). But he also wonders whether this particular medium has reached the end of its viability. He writes:
“…there was an assumption that carried across Vine, Facebook Watch, TikTok, and Instagram Reels that the economics of scale and attention would eventually make sense. That short-form video would eventually mean something. That either creators would get the chance to ‘graduate’ from short-form video to TV and movies or, at the very least, make something that felt more important. Instead, things have only become stupider and more wasteful, as platforms demand more video content than ever.”
In the middle of Broderick’s piece was a link to a post on X by Ed Elson about how clips have become the dominant form of social media content.
But I didn’t notice this citation until a few days later when I returned to Broderick’s piece. You see, I noticed that The Atlantic’s Charlie Warzel was also talking about clips on his podcast, Galaxy Brain.
But whereas Broderick was warning about the bubble popping, Warzel’s guest was claiming that clips were ascendant and that if you didn’t share your stuff in the form of clips, people would be force-fed clips of odious content from the likes of looksmaxxer Clavicular and white supremacist Nick Fuentes.
Warzel’s guest? One Ed Elson, host of the Prof G Markets podcast and author of the Simply Put newsletter.
Early in the episode, I largely agreed with Elson’s initial analysis. One point that I got excited about was that Elson argued that clips aren’t promotional content. They are content. To be successful, a clip should stand on its own in a (relatively) meaningful way. Not to toot my own horn, but I’ve been saying this in a slightly different form for a long time now. And the good folks at SparkToro even gave this kind of short-form-from-long-form content a name: zero-click content. As in, a snippet or clip of your longer-form content should be valuable on its own without the need to click to the longer version.
Okay. So far, so good.
But then Elson started talking metrics.
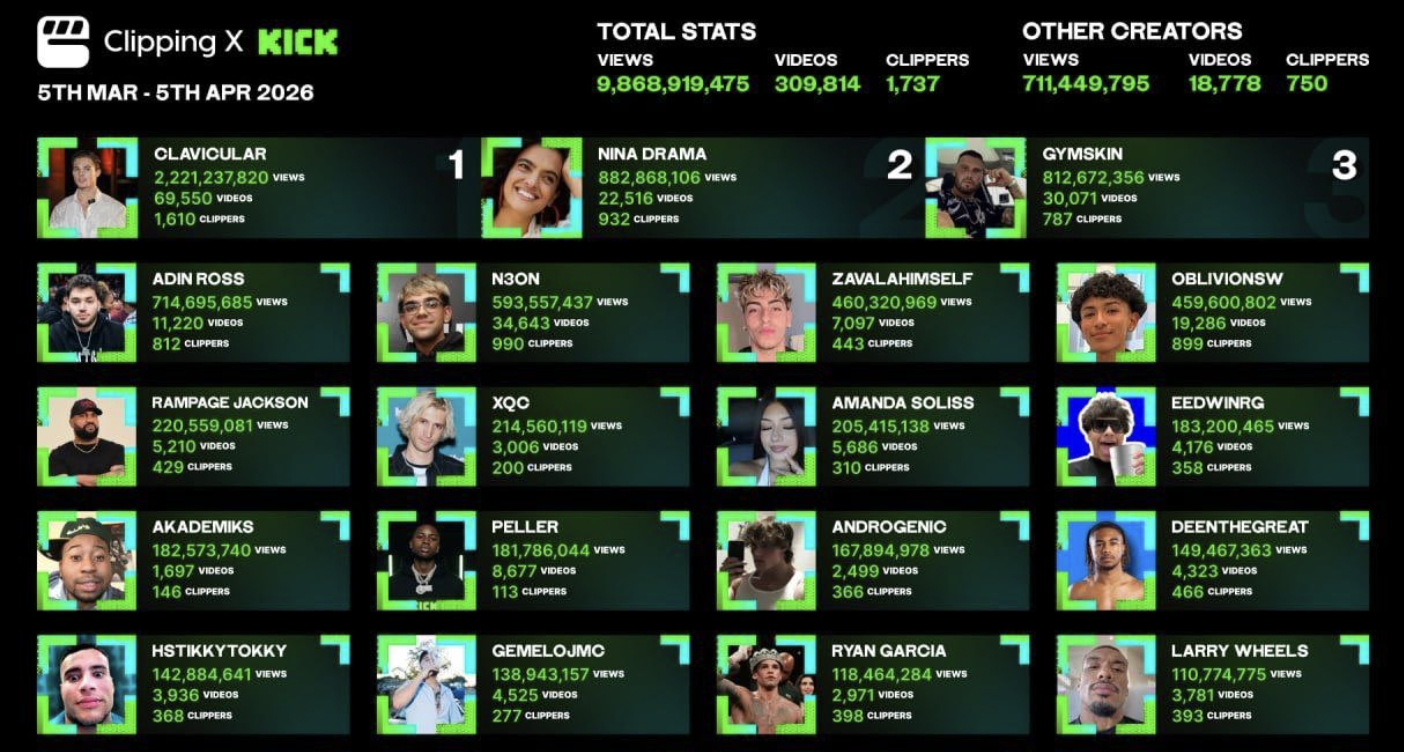
It was metrics that started the whole conversation. The clipping marketplace platform aptly named Clipping recently released data on Kick top-streamers' clip performance. The tl;dr is that clips are racking up millions and even billions of cumulative views across thousands of clips for individual creators per month.
“(Look at all of these people who you’ve never heard of who do not matter.)”
— Ryan Broderick, Garbage Day
When Elson compared those view counts to the number of people actually tuning into the daily shows of these streamers, he was shocked at just how much further the clips reached. That's when he started to draw conclusions that got me worked up.
“Worked up” looks just like this recent Hank Green video, in which he gets “worked up” about a bad-faith explanation of climate data.
You might wonder, "Why, Tara? Why get worked up about this?" There are many reasons. But my consternation boils down to this: bad data analysis affects how people spend their time and money in ways that hurt them and, in the case of social media, help platforms. And because so many people feel like they should make data-driven decisions even though they struggle to make sense of data for a variety of reasons, when someone with a significant platform starts making pronouncements about what works (self-own absolutely implied), it has a material impact on people.
Data-driven decision-making is great and all, as long as you realize that data aren’t actually what drives decisions.
We create narratives from data, theories for why the numbers add up the way they do, and what it means for us. We can have all the best data, and if our narrative—our interpretation of that data—is wrong, we can still make terrible decisions.
That’s why I get so worked up about this stuff.
Let me forestall my explanation of analysis just a bit longer to explain what I do agree with Elson on: the strategic challenge he's trying to address.
Distribution & Discovery Are Hard
Making media is possible for more people today than at any time in history. We have more places to share that media so people can read, watch, or listen to it.
What is hard today—like really hard—is actually connecting the media you create to the people who would want to read, watch, or listen to it. For a brief period in the 2010s, this seemed like a solved problem. Social media! Post your article to Facebook. Share your video on YouTube. Put your pic on Insta. And you were good to go.
But as we now know, the all-but-guaranteed reach of our posts at the time was because we were early in the enshittification cycle. Platforms wanted to be attractive to people who made media and posted content. They needed posts to fill their feeds so they could increase ad inventory and make more money.
“Here’s the natural history of enshittification:
First, platforms are good to their users.
Then they abuse their users to make things better for their business customers.
Next, they abuse those business customers to claw back all the value for themselves.
Finally, they have become a giant pile of shit.”
— Cory Doctorow, Enshittification
Once those feeds filled up, the reach evaporated. Distribution was no longer a given, even for people who indicated they wanted to see your content.
And if even your fans weren't seeing your content, what hope did you have of reaching people who hadn't yet discovered your content? Slim to none.
With the rise of TikTok and algorithmic distribution that's interest-based rather than follower-based, we got a new tool for distribution and discovery. So I agree with Elson when he explains that short-form vertical video is a key way for many creators and media businesses to reach new audiences.
When you create long-form content—let’s say over 15 minutes or 1500 words, you're asking people to make a big commitment. Heck, it's hard to find 15 minutes to run an errand, let alone watch or listen to someone I don't know from Adam. But I always have 15 minutes (or 2 hours...) for Michael Hobbes, Adrian Daub, or Nilay Patel because they've earned my trust over time. Short-form content is one way to earn trust over time without a big ask up front. Posting clips of longer-form content lets people warm up to you and your style before making a long-form commitment.
There are other avenues for reaching new audiences. So if short-form video isn't your thing, you've got options. But any media maker needs some way to get in front of new-to-you viewers, readers, or listeners if growing a platform and/or increasing impact is a goal.
Had the strategic level of Elson's argument stopped here, I might have forgiven the botched data analysis. But it didn't. Elson argues that clips are the dominant medium today, so dominant that they are worth more to the media maker than the content they're based on.
Maybe, maybe there is a business model where this makes sense. But if there is, it's niche, precarious, and probably not all that profitable.
Instead, clips—and really any distribution and discovery strategy—need to be part of a larger strategy for creating value and catalyzing exchange. You can't run a business on traffic alone. A sustainable media business requires an engaged audience who trusts it with their time and curiosity.
That's where the data-driven decision-making can come in handy. That is, as long as you approach the data correctly.
Anyhow, let me walk you through the common pitfalls Elson’s analysis falls right into and how you can avoid the same pitfalls in whatever metrics you’re needing to analyze and act on.
Apples and Oranges
My number one rule of data analysis is to only ever compare apples to apples and oranges to oranges. Don’t assume two metrics are equivalent just because they have similar (or even the same!) labels. Don’t assume that one respondent is the same as the next. Don’t assume that other variables haven’t substantively changed the meaning of a metric causing it to diverge from others that seem similar.
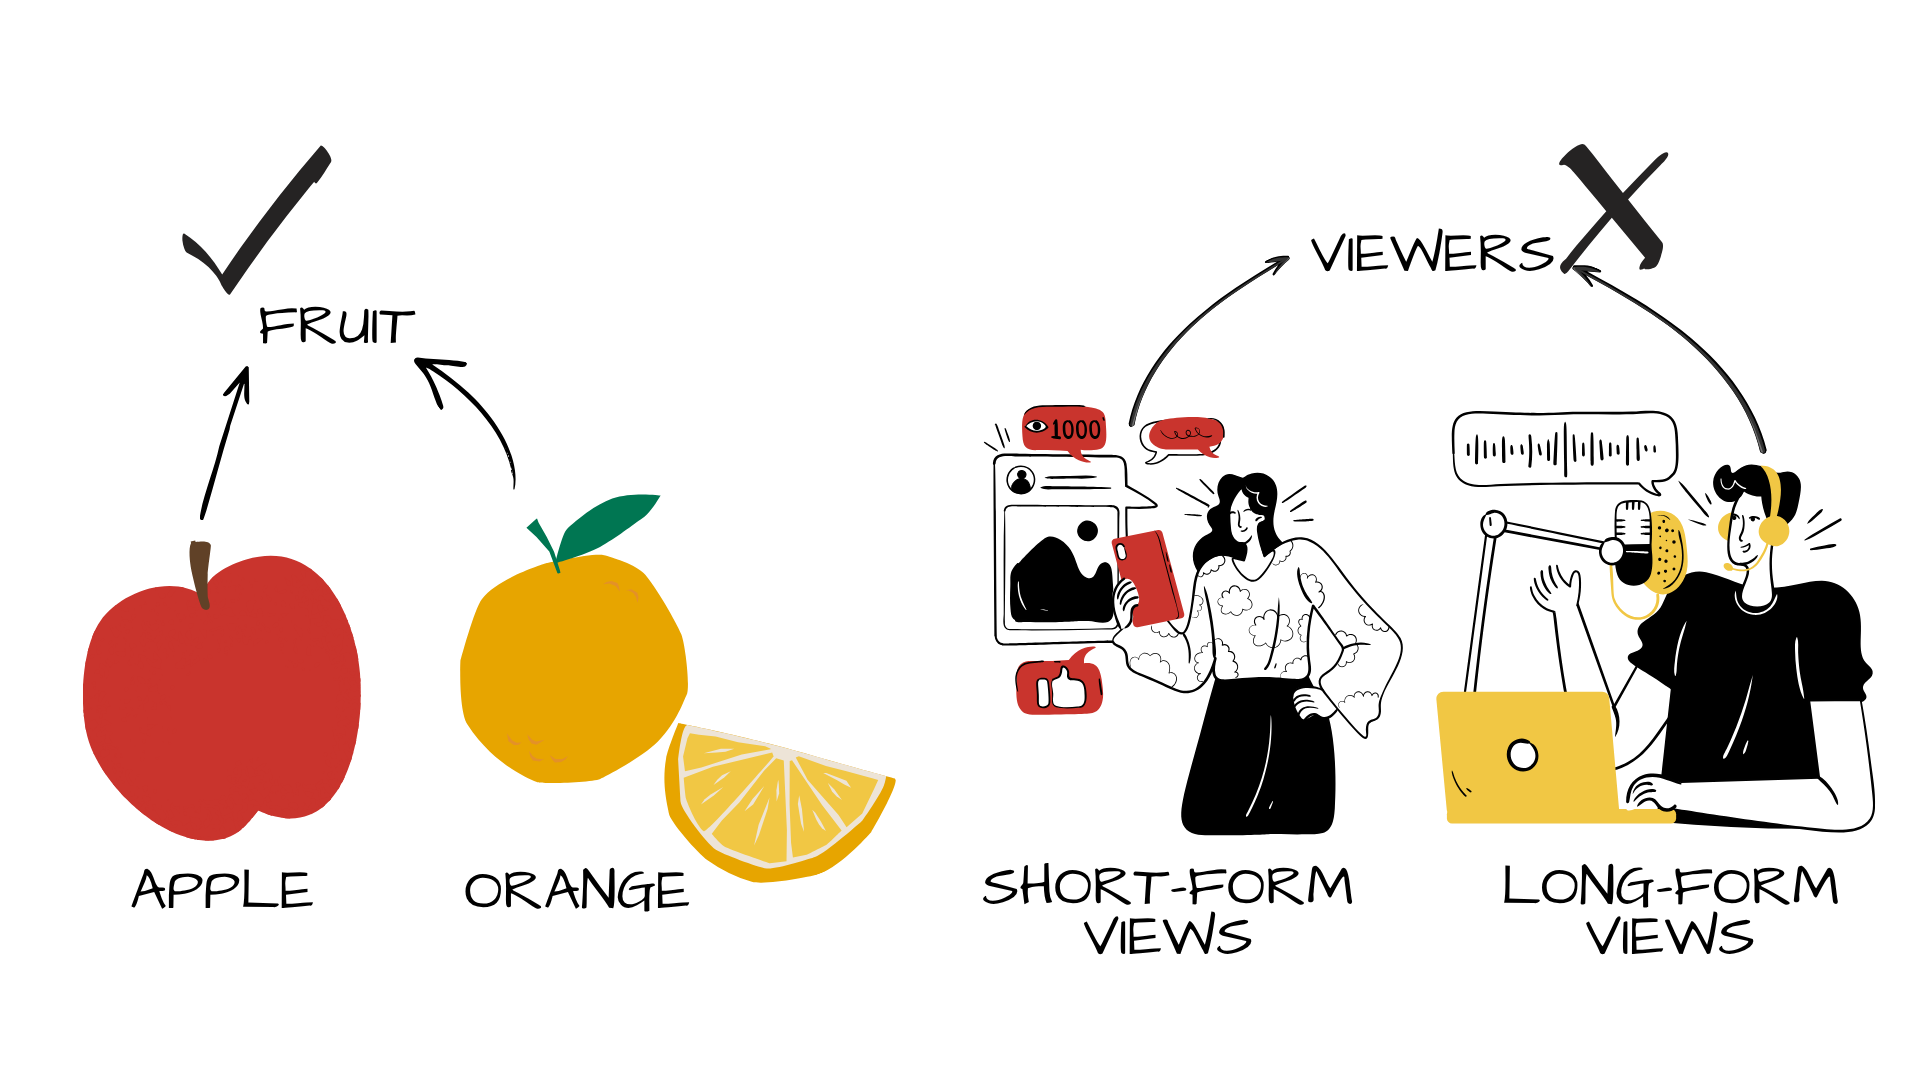
Elson’s analysis makes the classic mistake of comparing apples to oranges.
He equates views with viewers.
Here’s how Elson put it in his conversation with Charlie Warzel:
“…we were just looking at [Clavicular’s] total number of clips on Kick. It came in at over 2 billion views on clips.
But when you look at their actual shows, the numbers are in a completely different world. So we looked at the average concurrent views across these livestreamers’ shows. For Hasan Piker, it was around 30,000. For Nick Fuentes, it was around 20,000. For Clavicular, it was even less than that. It was about 16,000. That is not a big number for a lot of these shows. And yet that is the average for their concurrent views.
And then you look at the clip viewership. And we just looked at a small sample size, because there have been a lot of clips. But for Hasan Piker, the average was above 700,000 views. For Nick Fuentes, the average was above half a million views. For Clavicular, it was a quarter of a million. I looked back at one of Nick Fuentes’s most recent clips. It reached 11 million people, which is more than the population of New York City.”
Elson’s article about this phenomenon is full of simple charts that compare the gargantuan total views of a creator’s clips to the more modest views of their long-form content. You can’t do this. First, views of vertical videos are counted very differently from concurrent views of a livestream (I’ll explain in a minute). Second, comparing metrics across different platforms means comparing metrics related to differing norms, incentives, and culture. Those variables impact the nature of the unit of measure in real ways.
To compare apples to oranges, you first have to convert them into a shared category.
“Fruit” is one category that apples and oranges have in common. If you have 5 apples and 3 oranges, you have 8 pieces of fruit. True enough! And if that’s a useful metric for you, it’s a totally fair way to look at the data. Of course, if you only know that you have 8 pieces of fruit, that data point doesn’t tell you anything about its constituent parts. You could have 7 kiwis and 1 tomato. You could have 3 persimmons and 5 papayas. I’ll refrain from naming more fruits.
Another way to think about this is to consider how we adjust for inflation when thinking about relative buying power—that is, how $1 changes over time.
To compare the cost of a gallon of milk across the decades, you have to adjust for inflation (at the very least). For example, in simple terms, $1 in 1940 was the equivalent of just under $23 today. When I got my driver’s license back in the 1900s, gas cost about $1 per gallon. That’s equivalent to just under $2 today. So it’s significantly less than gas costs today (about $4.30 where I live). But it doesn’t cost 4x what it did in 1998. It’s a little more than double.
To compare vertical video views to long-form content views, you need a similar conversion.
If we’re hoping that a view is a unit that means something like the reach of a brand or message, what is the equivalent number of vertical video views to a view of long-form content? That is, I think we can agree that views of a TikTok video are less meaningful in terms of brand or message impact than views of long-form content. So what’s the ratio? 3 to 1? 1000 to 1? 10,000 to 1? I don’t know. However, I know for sure that assuming a 1-to-1 ratio will lead to faulty analysis and poor strategic decisions.
But maybe it’s simpler than that.
(It’s not, but go with me.)
Elson abstracts views into viewers. A view on TikTok is one viewer. A view on a livestream is one viewer.
Except that’s not how “views” as a metric works.
When Elson says that Fuentes’s recent clip reached 11 million people (“more than the population of New York City”), he means that it had 11 million views. When he says that Fuentes’s stream has 20,000 concurrent views on average, he means that 20,000 people tuned into the stream. So 11 million viewers versus 20,000 viewers.
But again, that’s not what those numbers mean.
“Views” means plays of a video, not the number of people who watched it. Can you extrapolate some viewership information from that number? Sure, maybe, sort of. But you can’t conclusively state that a clip reached more people than the population of New York City simply because of its view count. “Views” include replays. They rack up even as people scroll right on past them in the feed. Views are not viewers.
TikTok counts views on videos shorter than 3 min almost as soon as it begins to play. So your run-of-the-mill 90s clip is going to rack up views from people who swipe up on it as soon as their brains register it’s not something they’re interested in. Instagram, on the other hand, uses a 3s threshold for counting a view. That seems like an eternity next to TikTok’s standard, but it’s still nothing you’d register as meaningful engagement outside of the bizarre game space that social media has created.
And all of this assumes that platforms are reporting metrics in good faith, something that is far from a given.
When it comes to the long-form content views, the mischaracterization is just as bad. Elson notes that he’s using “average concurrent views.” I understand that to mean the number of people watching at any given time, averaged out over the duration of the content. For example, you might have 35,000 people tuning in five minutes into the stream, 15,000 people tuning in an hour into the stream, and 20,000 people tuning in ninety minutes into the stream. The average of those three counts is 23,000 concurrent views (this calculation is wildly simplified!).
Concurrent views are actually concurrent viewers. But but but! That number doesn’t tell you anything about the total viewership for a piece of content. An average of 15,000 views on a 30-minute live video is vastly different from an average of 15,000 concurrent views on a 6-hour livestream. Because viewers churn during the duration of the stream. The 15,000 people watching in the third minute might be a completely different set of viewers in the thirtieth minute. The longer the livestream, the higher the likelihood that the concurrent viewers have churned many times over. An average of 15,000 concurrent views might underrepresent the 60,000 people who tuned in over the duration of the stream.
・・・
Rule (of Thumb) One:
Always compare apples to apples. If you absolutely must compare apples to oranges, make sure the category you abstract to (e.g., fruit) accurately represents the metrics you’re comparing.
If you’re going to use data to make decisions, learn what the metrics you have mean, how they relate to each other (or don’t), and what impact they have on your [business, work, creative pursuits, etc.]. Use precise language to talk about data. Don’t say “people” if you mean “views” or “downloads” or “clicks.” What a metric measures and what you believe that metric signifies are often two very different things. Mixing them up can lead to unproductive strategic decisions (or worse).
・・・
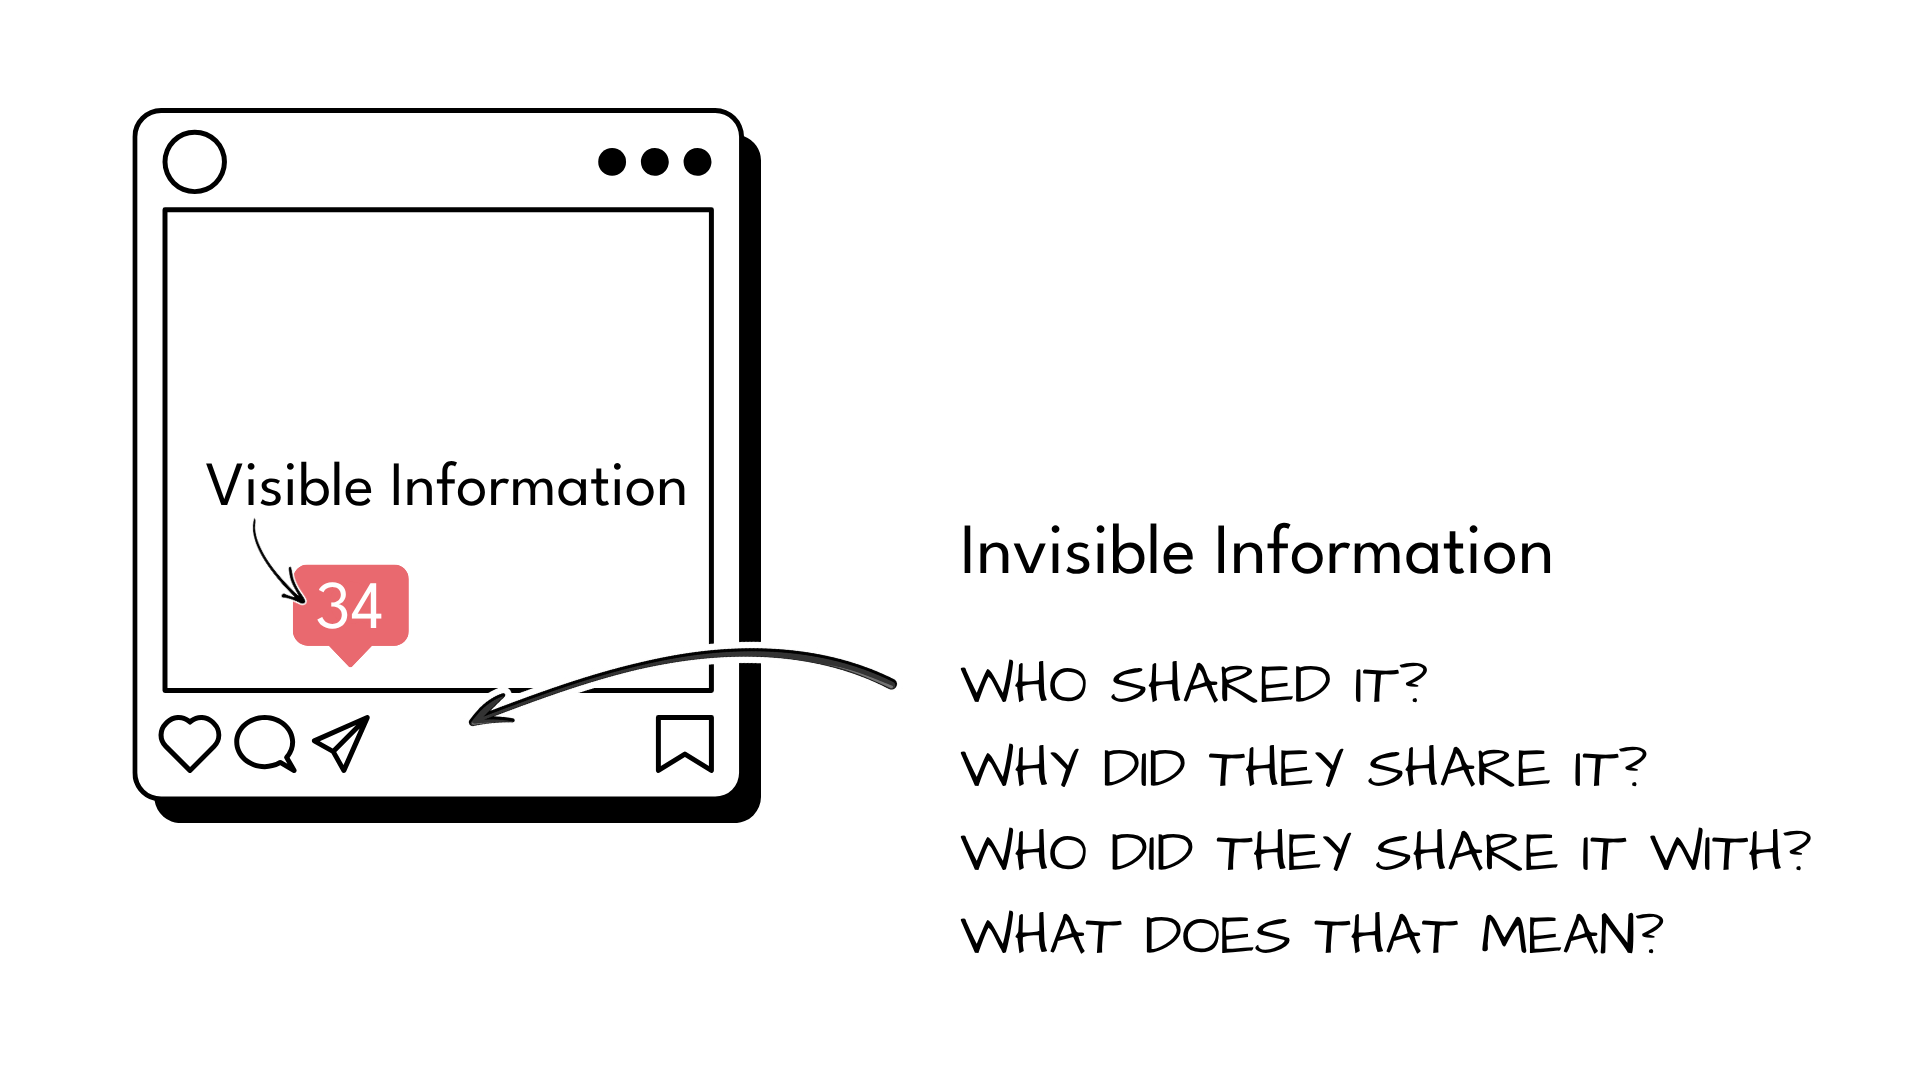
Iceberg Metrics
Every metric is an iceberg. The part you can see (e.g., views) takes your focus away from the mass of information and context beneath the surface.
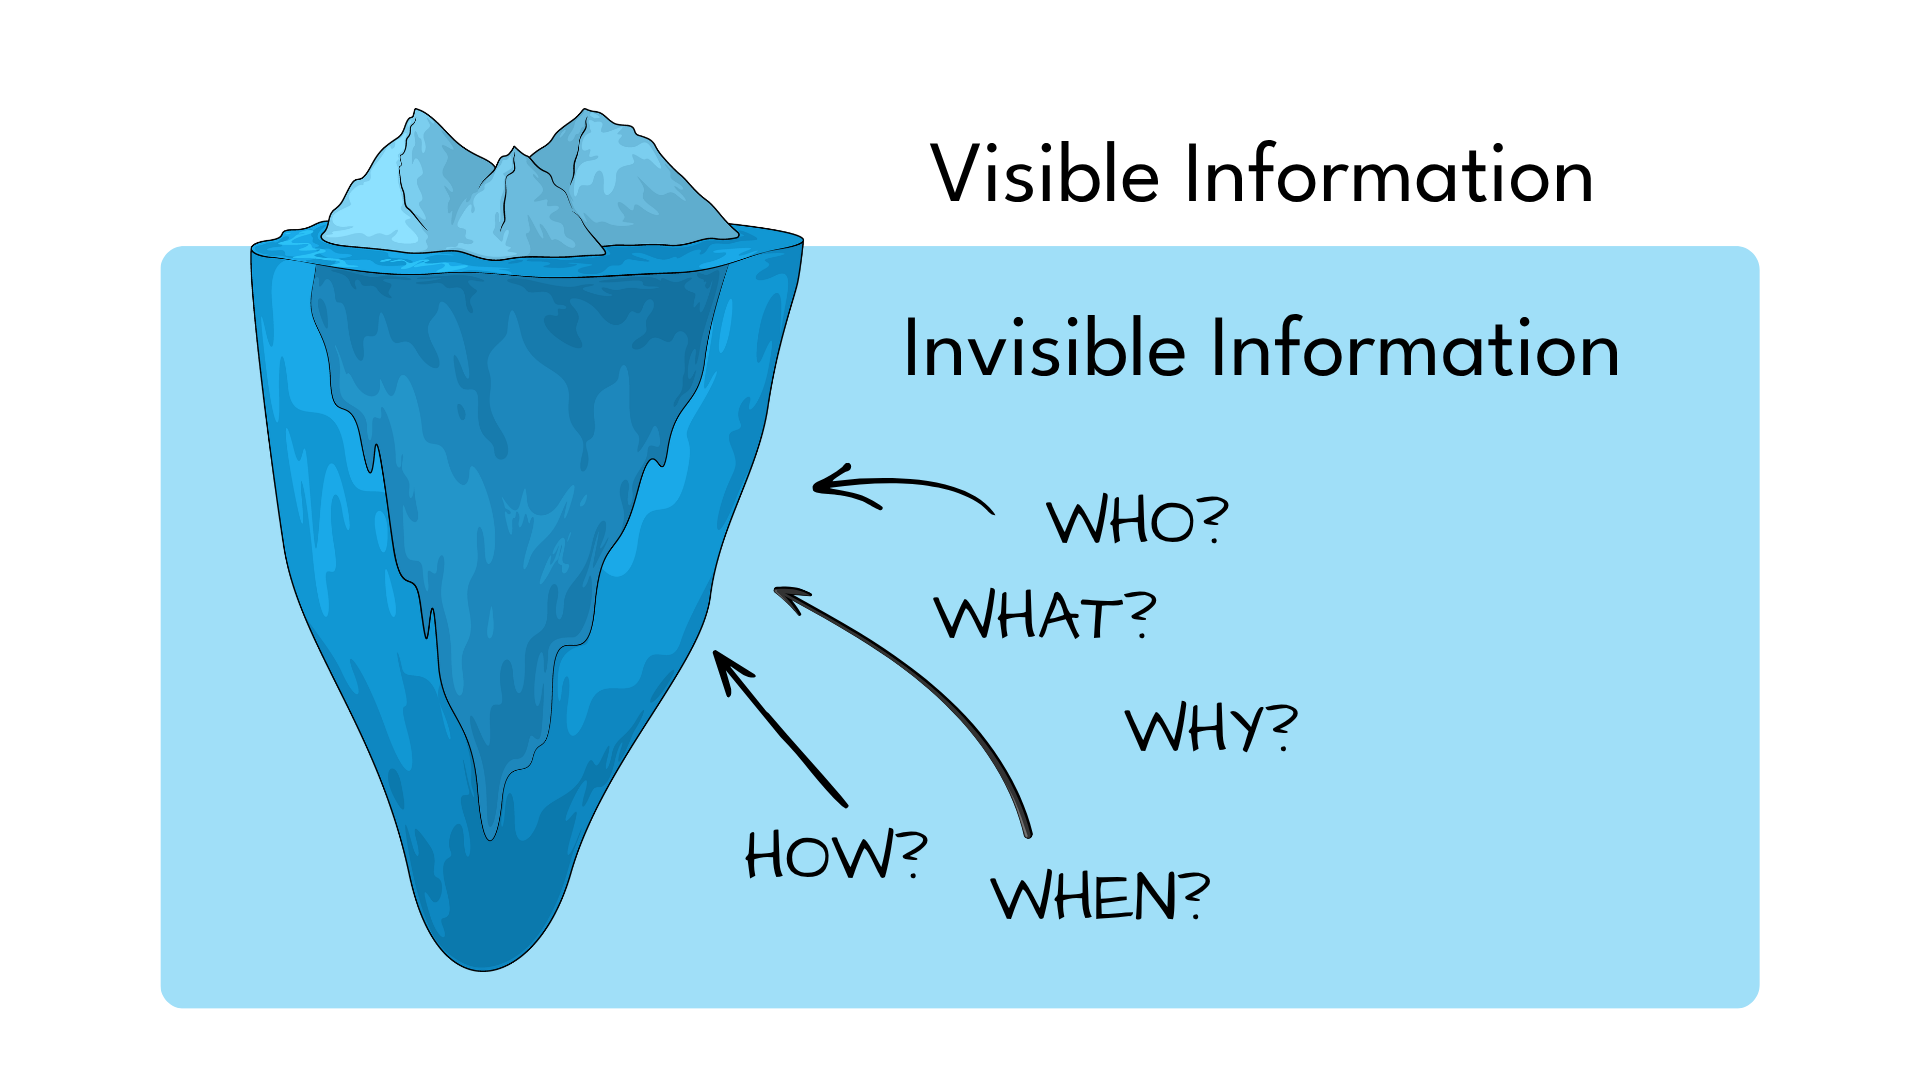
Here’s what I mean. We see the number of “shares” on a post, but we don’t know why or with whom that post was shared. Someone might share a post that angered them, delighted them, or surprised them. They might share for laughs or for tears. They might share with their partner, their college roommate, their client, their parent, or their child. No two shares have exactly the same context lurking beneath the surface.
“Views” are also iceberg metrics. Building on what I said early about the ratio of vertical video views to long-form content views, the invisible information contained in a TikTok “view” is fundamentally different from that contained in a YouTube or Twitch “view.” TikTok delivers videos to you passively based on what it’s algorithm calculates you want. It’s a very low-intent platform. That has significant strategic upsides! Namely, TikTok has greater potential for distribution to new audiences than legacy platforms that are built on active follows rather than passive consumption.
Platforms like YouTube and Twitch have some mechanisms for distribution to new audiences, but largely revolve around viewers opting in to follow individual channels or seeking out specific videos. Each view of a YouTube video indicates greater intent by the viewer. Podcasts, while not (mainly) a video medium, indicate incredibly high intent by the listener because there is almost no passive distribution to new audiences on podcast apps.
The deviation between low- and high-intent views matters because it indicates how different media forms fit into a media-creation ecosystem.
That is, some platforms (and associated media forms) are good for reaching new people. Others are good for nurturing audiences. And still others are good for converting audiences into paying customers. A robust and sustainable media ecosystem accounts for each of these functions.
Elson’s analysis smashes these various contexts like a looksmaxxer working on his jawline. He told Warzel:
“…what I started to realize is: It’s not about the show. It’s about the clip. That’s how these guys are reaching people. And not only that, that is how the content is primarily being consumed. So it’s not just a medium to get the word out about who you are. It’s the entire medium.”
Maybe? Maybe that’s true for the three “new media superstars” Elson chose to focus on in his analysis, but if it is true, that doesn’t say much about their actual influence. Ubiquity doesn’t always amount to impact. And impact doesn’t always amount to ubiquity.
You can think of different forms of media as landing somewhere on the spectrum between pure algorithmic distribution and pure user-directed engagement. TikTok is closer to the far end of the algorithmic distribution side, while podcasts and books are on the user-directed engagement side. User-directed engagement always yields a higher impact on investment than algorithmic distribution. But algorithmic distribution is, in today’s media landscape, an important consideration in growing the number of people who want to take the time to hear you out in full.
If Hasan Piker, Clavicular, and Nick Fuentes have real influence, then it’s generated by moving viewers beyond low-intent platforms. That is, low-intent platforms are where people find you. High-intent platforms are where influence actually occurs. I will get to the choice of these three chaos bros in just a bit.
・・・
Rule (of Thumb) Two
Beneath every metric is loads of information you can’t see until you go looking for it. By considering results in light of that nonobvious information, you can assess performance more accurately and tell a more meaningful story about data.
In the case of media production, this deeper analysis will result in an ecosystem approach, where you see various media forms serving different functions within your overall strategy.
Generally speaking, more textured data analysis will result in a more nuanced model of reality that ultimately allows you to navigate change, uncertainty, and surprise more sustainably.
・・・
The Stakes
“…the way I see it, it’s a competition. It’s like: Either kids are gonna watch Clavicular, and they’re gonna smash hammers into their face to looksmaxx, or they’re gonna watch something else. And I wanna be the something else,” Elson explained to Warzel. And look, I know he’s being purposefully hyperbolic here (at least, I hope he is). But this is very silly.
The internet is full of all types of content and creators. No matter how ubiquitous Clavicular, Nick Fuentes, and Hasan Piker might seem, I’m quite certain there is a not-insignificant number of people reading these words who don’t know who those people are. It is simply not a competition between my content, your content, or Elson’s content and those three dudes.
Raising the stakes like this—‘it’s either my stuff or their stuff’—is a heuristic that leads to counterproductive, reactionary decision-making. It both causes bad data analysis and is exacerbated by bad data analysis. Raising the stakes is also a classic move of people who really want you to buy their argument (often literally) without having a compelling one on offer.
See also: AI is an existential risk to the future of humanity. AI will take your job. AI will take all the jobs.
Elson continued to double down on the stakes of his argument throughout his conversation with Warzel:
“But when it comes to people like us—content creators, people in media—my view is we should be putting stuff out there. We should be competing with Clavicular. I would rather a young person watches my video where I talk about ways to establish economic security in America versus a young person watch a video of Clavicular smashing his face and doing meth off camera. And I think it’s incumbent on everyone who cares about their work in media to think quite deeply about this question and recognize that if they’re not watching you, they’re watching Nick Fuentes, they’re watching Hasan Piker, they’re watching Clavicular. They’re watching all of these guys. If you don’t get yourself out there on these social-media platforms, that’s who’s gonna fill the void.”
Not only is this argument over the top, but it betrays a lack of understanding how algorithmic distribution works. Algorithms are programmed to show you things that are adjacent to the content you've engaged with in the past. If I watched a bunch of Crooked Media clips on TikTok, I might get served a Hasan Piker clip because he's appeared on their shows before. But I would never get a Clavicular or Fuentes clip. If someone watches a bunch of Tucker Carlson or Info Wars clips, they may very well get a Fuentes clip fed to them. They would never get a Tara McMullin clip fed to them.
I can't compete for views with the likes of Fuentes or Clavicular because no algorithm would ever show my content to someone who is earnestly engaged with their content. Algos are not programmed to show misogynist white supremacists content from anti-capitalist, radical feminists. Maybe, possibly, there's a small chance that I might compete with Piker for views, but his audience and my potential audience would only overlap in the teeniest tiniest ways.
Sometimes videos break containment and are distributed to wider (and unsympathetic) audiences, but that's not something to build a media strategy around.
・・・
Rule (of Thumb) Three:
Panic makes for terrible strategy. Don't exaggerate the stakes or you'll end up sinking time, money, and focus into tactics divorced from reality.
・・・
Comprehension Over Correlation
Toward the end of The Crisis of Narration, Byung-Chul Han cites an essay by Chris Anderson, co-founder of Wired, in which Anderson makes some big assertions about the power of data at scale. Han quotes Anderson:
"Out with every theory of human behavior, from linguistics to sociology. Forget taxonomy, ontology, and psychology. Who knows why people do what they do? The point is they do it, and we can track and measure it with unprecedented fidelity. With enough data, the numbers speak for themselves."
With enough data, the numbers speak for themselves. Except that, as I've hopefully made clear in the screed above, they don't.
Han rebuts Anderson's claim:
"But big data does not explain anything. Big data merely discloses correlations between things. Correlations are the most primitive form of knowledge. They do not allow us to understand anything. Big data cannot explain why things are correlated in the way they are. It does not establish causal or conceptual connections. The question ‘why?’ is replaced with a non-conceptual ‘this-is-how-it-is’.
As a narrative, theory designs an order of things, setting them in relation to each other. Theory thereby explains why they behave the way they do. It develops conceptual contexts that make things intelligible. Unlike big data, theory offers us the highest form of knowledge: comprehension. Theory is a form of closure that takes hold of things and thereby makes them graspable." (emphasis added)
The proliferation of data and the omnipresence of iceberg metrics beg us to treat the numbers as if they speak for themselves. Ultimately, this is where Elson's characterization goes wrong—and where countless others have gone wrong, betting that the numbers are a glimpse into a world that's more real than the real world. It's a trap I've fallen into plenty of times myself.
Data, especially in the form of seemingly unimpeachable metrics, promises us an objective foundation for decision-making. This is how it is. But without theory, without narrative, without asking "Why?" we've got nothing to fall back on when the game inevitably changes. A nuanced interpretation of data is critical to sustainable strategy, whether you're playing in the "clip economy" or working on a project at a Fortune 500 or even parenting your child through their school years.
Without giving care to the narrative we form around data, we fall prey to the fiction so often represented as fact—that the numbers speak for themselves. We hand over our limited time, energy, and money to a course of action that benefits corporations and erodes culture.
Last Thing
Donella Meadows encourages systems thinkers to engage with the behavior of a system and its history in order to develop dynamic analysis that leads to important questions: "not only to'What’s wrong?' but also to 'How did we get there?' 'What other behavior modes are possible?'"
This kind of analysis, with an emphasis on considering how systems behave over time, prevents "the common and distracting tendency we all have to define a problem not by the system’s actual behavior, but by the lack of our favorite solution." If your favorite solution is always the one that has you chasing reach, influence, and virality, there's a good chance every problem will look like one that can be solved with some combination of those factors. If you perceive the root of the problem as a lack of your own fame, you'll always be looking for ways to achieve it.
If you're after something more, if you're after comprehension rather than false certainty, impact over ubiquity, then look past the false neutrality of data. Without our healthy skepticism on that front, as Douglas Rushkoff writes, "the choices are not choices at all, but a new way of getting us to accept limitations. Whoever controls the menu controls the choices."
Don't let the numbers speak for themselves—because they're always speaking for someone else's goal.